Who does London's welcome reach?
Think about what it means to trust your neighbours. Not deeply, just ordinarily; the low-level confidence that the people around you are generally on your side, that you can ask for directions, nod in the elevator, leave a note if your package arrives at the wrong door. It's a background hum most people don't notice until it's gone.
For many newcomers in London, that hum is present from early on. For others, it never quite starts.
A new survey of 387 permanent residents in London and Middlesex, conducted by the Network for Economic and Social Trends (NEST) in partnership with the City of London and LMLIP, asked participants about four aspects of their lives here: how much they trust people in their local community, how satisfied they are with the number of friends they have, how satisfied they are with their jobs, and how much discrimination they experience. All four were measured on a seven-point scale.
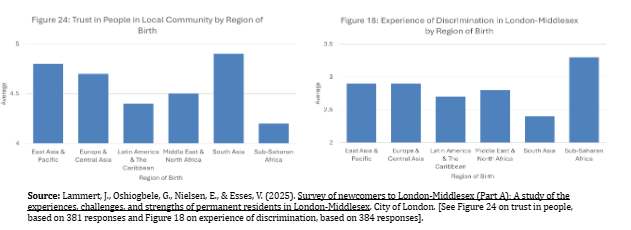
The results show a clear pattern by world region of birth. Permanent residents born in South Asia reported the best outcomes on all four measures, the highest trust, the most satisfaction with their friendships, the highest job satisfaction, and the lowest reported discrimination. Permanent residents born in Sub-Saharan Africa reported the opposite on every single measure: the lowest trust, the lowest satisfaction with friendships, the lowest job satisfaction, and the highest reported discrimination.
The same order appears across all four measures. That's what makes this finding hard to set aside.
The gradient
Between those two ends, other regions fall in ways that stay fairly consistent regardless of which measure you look at. For trust in the local community, the order runs from highest to lowest: South Asia, East Asia and the Pacific, Europe and Central Asia, the Middle East and North Africa, Latin America and the Caribbean, and Sub-Saharan Africa.
For the experience of discrimination, the order reverses. Sub-Saharan Africa reports the highest levels. Then East Asia and the Pacific, Europe, and Central Asia are tied. Then the Middle East and North Africa. Then Latin America and the Caribbean. Then South Asia, the lowest of all.
For friendship and job satisfaction, Sub-Saharan Africa sits at the bottom in both cases, with South Asia at the top.
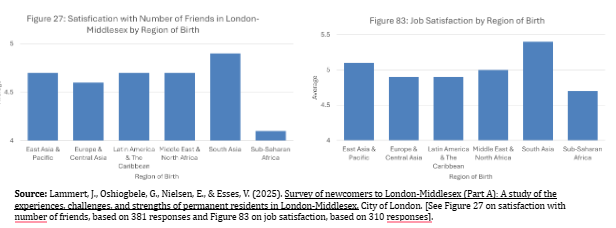
What stands out is not that some groups report more difficulty than others — that would not, on its own, be very surprising. What stands out is that the same group sits at the bottom of every single measure. Discrimination, trust, social connection, and work satisfaction. Four different questions, the same answer each time.
Why trust matters more than it might seem
Of the four measures, trust in the local community does the most quiet work in a person's daily life, and it's worth pausing on.
When you trust your neighbours, when you have some basic confidence that the people around you are not hostile to your presence, you ask for things. You ask a colleague where to find a good doctor. You ask another parent at school pickup whether the bus schedule is reliable. You mention to someone at work that you're looking for a new position. These small exchanges are how informal support networks form. And informal networks are often how people find work, get referred to services, and start to feel like they belong somewhere.
When that trust is low or absent, those exchanges don't happen. People manage alone. The connections that might have helped don't form, not out of stubbornness or reluctance, just because the conditions that make people reach out weren't there.
This is why the friendship satisfaction and job satisfaction findings are worth reading alongside the trust finding rather than separately. A person who doesn't feel trusted by their community is less likely to build the connections that lead to a satisfying social life or a rewarding work situation. The four measures are probably not four separate problems. They may be four ways of measuring the same one (though the survey itself can't prove that directly, more on that below).
What this data can and can't tell us
The survey is local, specific, and recent. It reflects the experiences of permanent residents in London and Middlesex as reported in 2025. That is its strength. What it can't do is explain exactly why the gradient exists.
"Sub-Saharan Africa" covers 46 countries — different languages, economies, migration histories, and circumstances. Some respondents may have arrived recently as refugees. Others may be long-settled economic migrants. Length of time in Canada, immigration class, language background — none of these were controlled for, and any of them could be contributing to the pattern.
That's worth taking seriously, and it's an argument for more detailed research.
But the consistency across four separate measures makes a simple confounding explanation harder to sustain. If arrival recency alone were driving outcomes, you'd expect it to affect some measures more than others, and you wouldn't necessarily expect the same ranking across discrimination, trust, friendships, and employment. Academic research on sub-Saharan African immigrants in Canada — spanning studies on settlement, health, and labour market outcomes — has consistently found that anti-Black racism is a specific driver of poor outcomes, one that operates separately from the barriers other immigrant groups face. The London data is consistent with that body of evidence, even if local survey data alone can't prove causation.
There's also something worth naming about the research gap itself. Sub-Saharan African immigrants are among the fastest-growing newcomer populations in Canada and among the least studied. That's not a coincidence, exactly. You can't design good services for people whose experiences haven't been documented.
London's wider context
These findings don't exist in isolation. London's own reporting shows that hate and bias-motivated crimes rose by nearly 40% in 2023 compared to 2022, and by 148% since 2020. Black communities were among the five most frequently targeted groups in both 2023 and 2024.
Most hate incidents are never reported to police — a well-documented pattern nationwide. The discrimination scores in this survey may therefore understate what permanent residents from Sub-Saharan Africa are actually experiencing day-to-day.
At the national level, Canada's Anti-Racism Strategy, launched in 2024, identifies anti-Black racism as a priority area across employment, housing, health, and immigration systems. The Second International Decade for People of African Descent runs from 2025 to 2034; Canada co-sponsored it at the UN General Assembly in December 2024. The local data from this survey fits into that larger picture — the gap between stated commitments and lived experience, measured here at the neighbourhood level.
What London has said it wants to be
LMLIP's work is guided in part by nineteen characteristics of a welcoming community, developed through research by Pathways to Prosperity. Two of them are directly relevant to these findings: Positive Attitudes Toward Immigrants of All Racial, Cultural, and Religious Backgrounds and Ongoing Commitment to Anti-Racism and Anti-Oppression.
The framework defines a welcoming community as one with structures and practices in place to support the inclusion of newcomers in all aspects of life, and that actively checks whether those structures are working.
This survey is a piece of that check. What it shows is that the welcome London extends is not reaching everyone equally. Permanent residents from Sub-Saharan Africa report the lowest trust, fewest friends, lowest job satisfaction, and highest discrimination, across every measure. That's a specific gap in a specific place. It can be named, and that naming is where things can actually change.
Matter of Facts is a research series produced by the LMLIP Fact Sharing Work Group. The data in this article is drawn from: Lammert, J., Oshiogbele, G., Nielsen, E., & Esses, V. (2025). Survey of newcomers to London-Middlesex (Part A): A study of the experiences, challenges, and strengths of permanent residents in London-Middlesex. City of London. See Figure 24 (trust in people, 381 responses), Figure 18 (experience of discrimination, 384 responses), Figure 27 (satisfaction with number of friends, 381 responses), and Figure 83 (job satisfaction, 310 responses).
Hate crime statistics are drawn from the 2023 and 2024 Hate/Bias Motivated Crime Report presented to the London Police Services Board.