Who Keeps London Moving?
New Data Reveals the Age and Home Life of Immigrants and Newcomers?
Who is powering London’s workforce? Who is raising families here? And who is building a life in shared homes while studying or working temporarily?
New data from the 2021 Census offers a revealing look at the people shaping London’s future. Behind the numbers is a clear story: immigrants are a major part of the city’s working-age population, and their household patterns reflect different stages of settlement, stability, and belonging. Meanwhile, non-permanent residents including many international students and temporary workers are even more concentrated in the working years, but are far more likely to live with non-relatives than with partners.
These patterns may seem simple at first glance, but they say a lot about how communities grow, how neighbourhoods change, and what kinds of support people need at different stages of life.
The Workforce Story Hidden in the Data
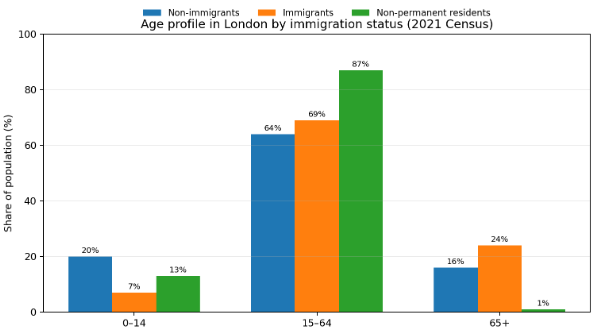
One of the strongest messages in the data is this: immigrants are more likely than non-immigrants to be in their prime working years.
According to the 2021 Census, 69% of immigrants are between the ages of 15 and 64, compared with 64% of non-immigrants. Immigrants also make up a much smaller share of children aged 0 to 14, but a larger share of adults aged 65 and over.
That means immigration is doing more than adding population growth. It is helping sustain the city’s labour force, filling workplaces with people who are building careers, supporting families, and contributing to the economy.
Not One Generation, but Many
A closer look shows that age patterns shift dramatically depending on when people arrived.
Immigrants who came to Canada from 1981 onward are mostly of working age. But among those who arrived in 1980 or earlier, 72% are now aged 65 and over. In other words, many of London’s earlier immigrant communities are now senior communities too.
Children aged 0 to 14 make up just 2% of immigrants who arrived between 2011 and 2015, but 24% of those who arrived between 2016 and 2021. That shift suggests many newer immigrants are arriving as young families, not just as individual workers.
This matters because cities do not just welcome newcomers once. They grow with them.
The Quiet Strength of Non-Permanent Residents
The data also highlights a group that often receives less attention in public conversations: non-permanent residents.
This population, which includes international students and temporary workers, is overwhelmingly concentrated in the working-age years. In fact, 87% are between 15 and 64. Only 13% are children, and just 1% are seniors.
This is a highly active group. They study, work, rent housing, use public transit, and participate in the daily rhythm of the city.
What Home Looks Like Tells Us Even More
Age alone does not tell the full story. Household patterns help us understand how people are actually living.
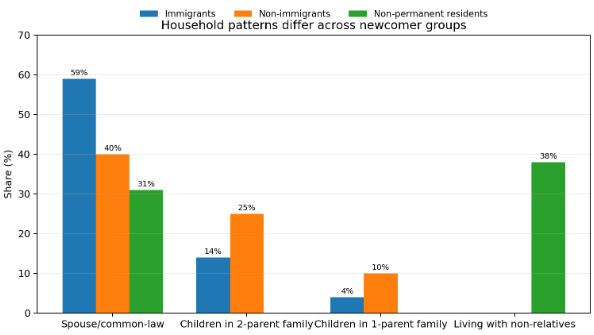
Immigrants are much more likely than non-immigrants to live with a married spouse or common-law partner. In London, 59% of immigrants live in this type of arrangement, compared with 40% of non-immigrants.
This suggests that many immigrant households are anchored by adult partnerships.
Settlement Changes Family Life Over Time
The most common living arrangement for immigrants, across every period of arrival, is living with a married spouse or common-law partner. But that pattern shifts depending on how long people have been in Canada.
Among immigrants who arrived before 2000, between 63% and 67% live with a spouse or common-law partner. For those who arrived between 2016 and 2021, that number drops to 50%.
The highest share of children living in two-parent families appears among the most recent immigrants, at 29%.
Living alone is most common among immigrants who arrived in 1980 or earlier, where 25% live alone. Among those who arrived between 2016 and 2021, only 4% do.
Roommates, Not Relatives
If immigrants are most likely to live with partners, non-permanent residents are far more likely to live with people they are not related to.
Among non-permanent residents, the most common living arrangement is living with non-relatives, at 38%. About 31% live with a married spouse or common-law partner.
That points to student housing, shared rentals, temporary work arrangements, and the practical realities of living in a city while building a future that may still be uncertain.
Why London Should Pay Attention
These numbers are not just demographic facts. They are signals.
They tell employers that immigrants are a critical part of London’s labour force. They tell schools and childcare providers that many recent newcomers are arriving with children. They tell housing planners that non-permanent residents may face very different living conditions from permanent immigrants or Canadian-born residents.
If we want to build a city where everyone can thrive, we need to understand not only who people are, but where they are in life.
More Than Numbers, These Are Life Stages
What this data really reveals is that immigration is not one experience. It is many.
It is the older adult who arrived decades ago and now lives alone. It is the newcomer couple building a future together. It is the family that recently arrived with children. It is the student sharing an apartment while studying and working.
And that is what makes this data so powerful. London is not just growing because of immigration. It is being shaped by it — at work, at home, and across every stage of life.
Resource Links
All Are Welcome Here blog example
Tone, structure, and online blog presentation model.
Statistics Canada, Census Program
National census context behind the figures summarized in the source.
London & Middlesex Local Immigration Partnership
Local settlement and immigration context for London-Middlesex.