New Maps Reveal Language Settlement Patterns Across London
People often think of London's diversity as something spread evenly across the city. New data from the London & Middlesex Local Immigration Partnership's Fact Sharing Work Group shows something different: language communities cluster in specific neighbourhoods, and the patterns matter for service planning.
Maps created from the 2021 Census reveal where Spanish-, Portuguese-, Mandarin-, and Arabic-speaking households are located across London. The data shows clear geographic patterns. Over 5% of households in Fox Hollow speak Arabic at home, the highest concentration in the city. Mandarin speakers cluster heavily in neighbourhoods in Northwest and West London, such as Woodhull, Hyde Park, and Masonville. Portuguese speakers concentrate in Masonville and parts of South and East London. Spanish speakers are present across multiple areas, with the strongest presence in the Fox Hollow, Hyde Park, West London, and South London neighbourhoods.
These patterns are not random. They show how communities form.
Why Communities Cluster
When families arrive in a new city, they often settle near others who share their language. This makes practical sense. A neighbour who speaks your language can explain which school offers strong English as a Second Language support. They know which doctor's office has staff who can communicate with you. They can tell you where to find ingredients that make food taste like home.
Community networks provide information that formal services cannot always offer. A Spanish-speaking family moving to London might learn through personal connections that Fox Hollow has other Spanish speakers, that certain businesses employ bilingual staff, or that specific schools have experience serving children who speak Spanish at home. This kind of knowledge helps families settle successfully.
Language also connects people to cultural practices, religious communities, and social support systems. Arabic speakers concentrated in Bostwick, Longwoods, and White Oaks can more easily form community groups, share rides to mosques, or organize cultural events. Mandarin speakers in Northwest London can build networks for job searching, childcare sharing, or simply friendship in a new country.
Geographic concentration creates strength. It allows communities to support each other through the challenges of settlement. It preserves language for children. It reduces isolation.
What The Data Shows About London
The maps reveal different patterns for each language group:
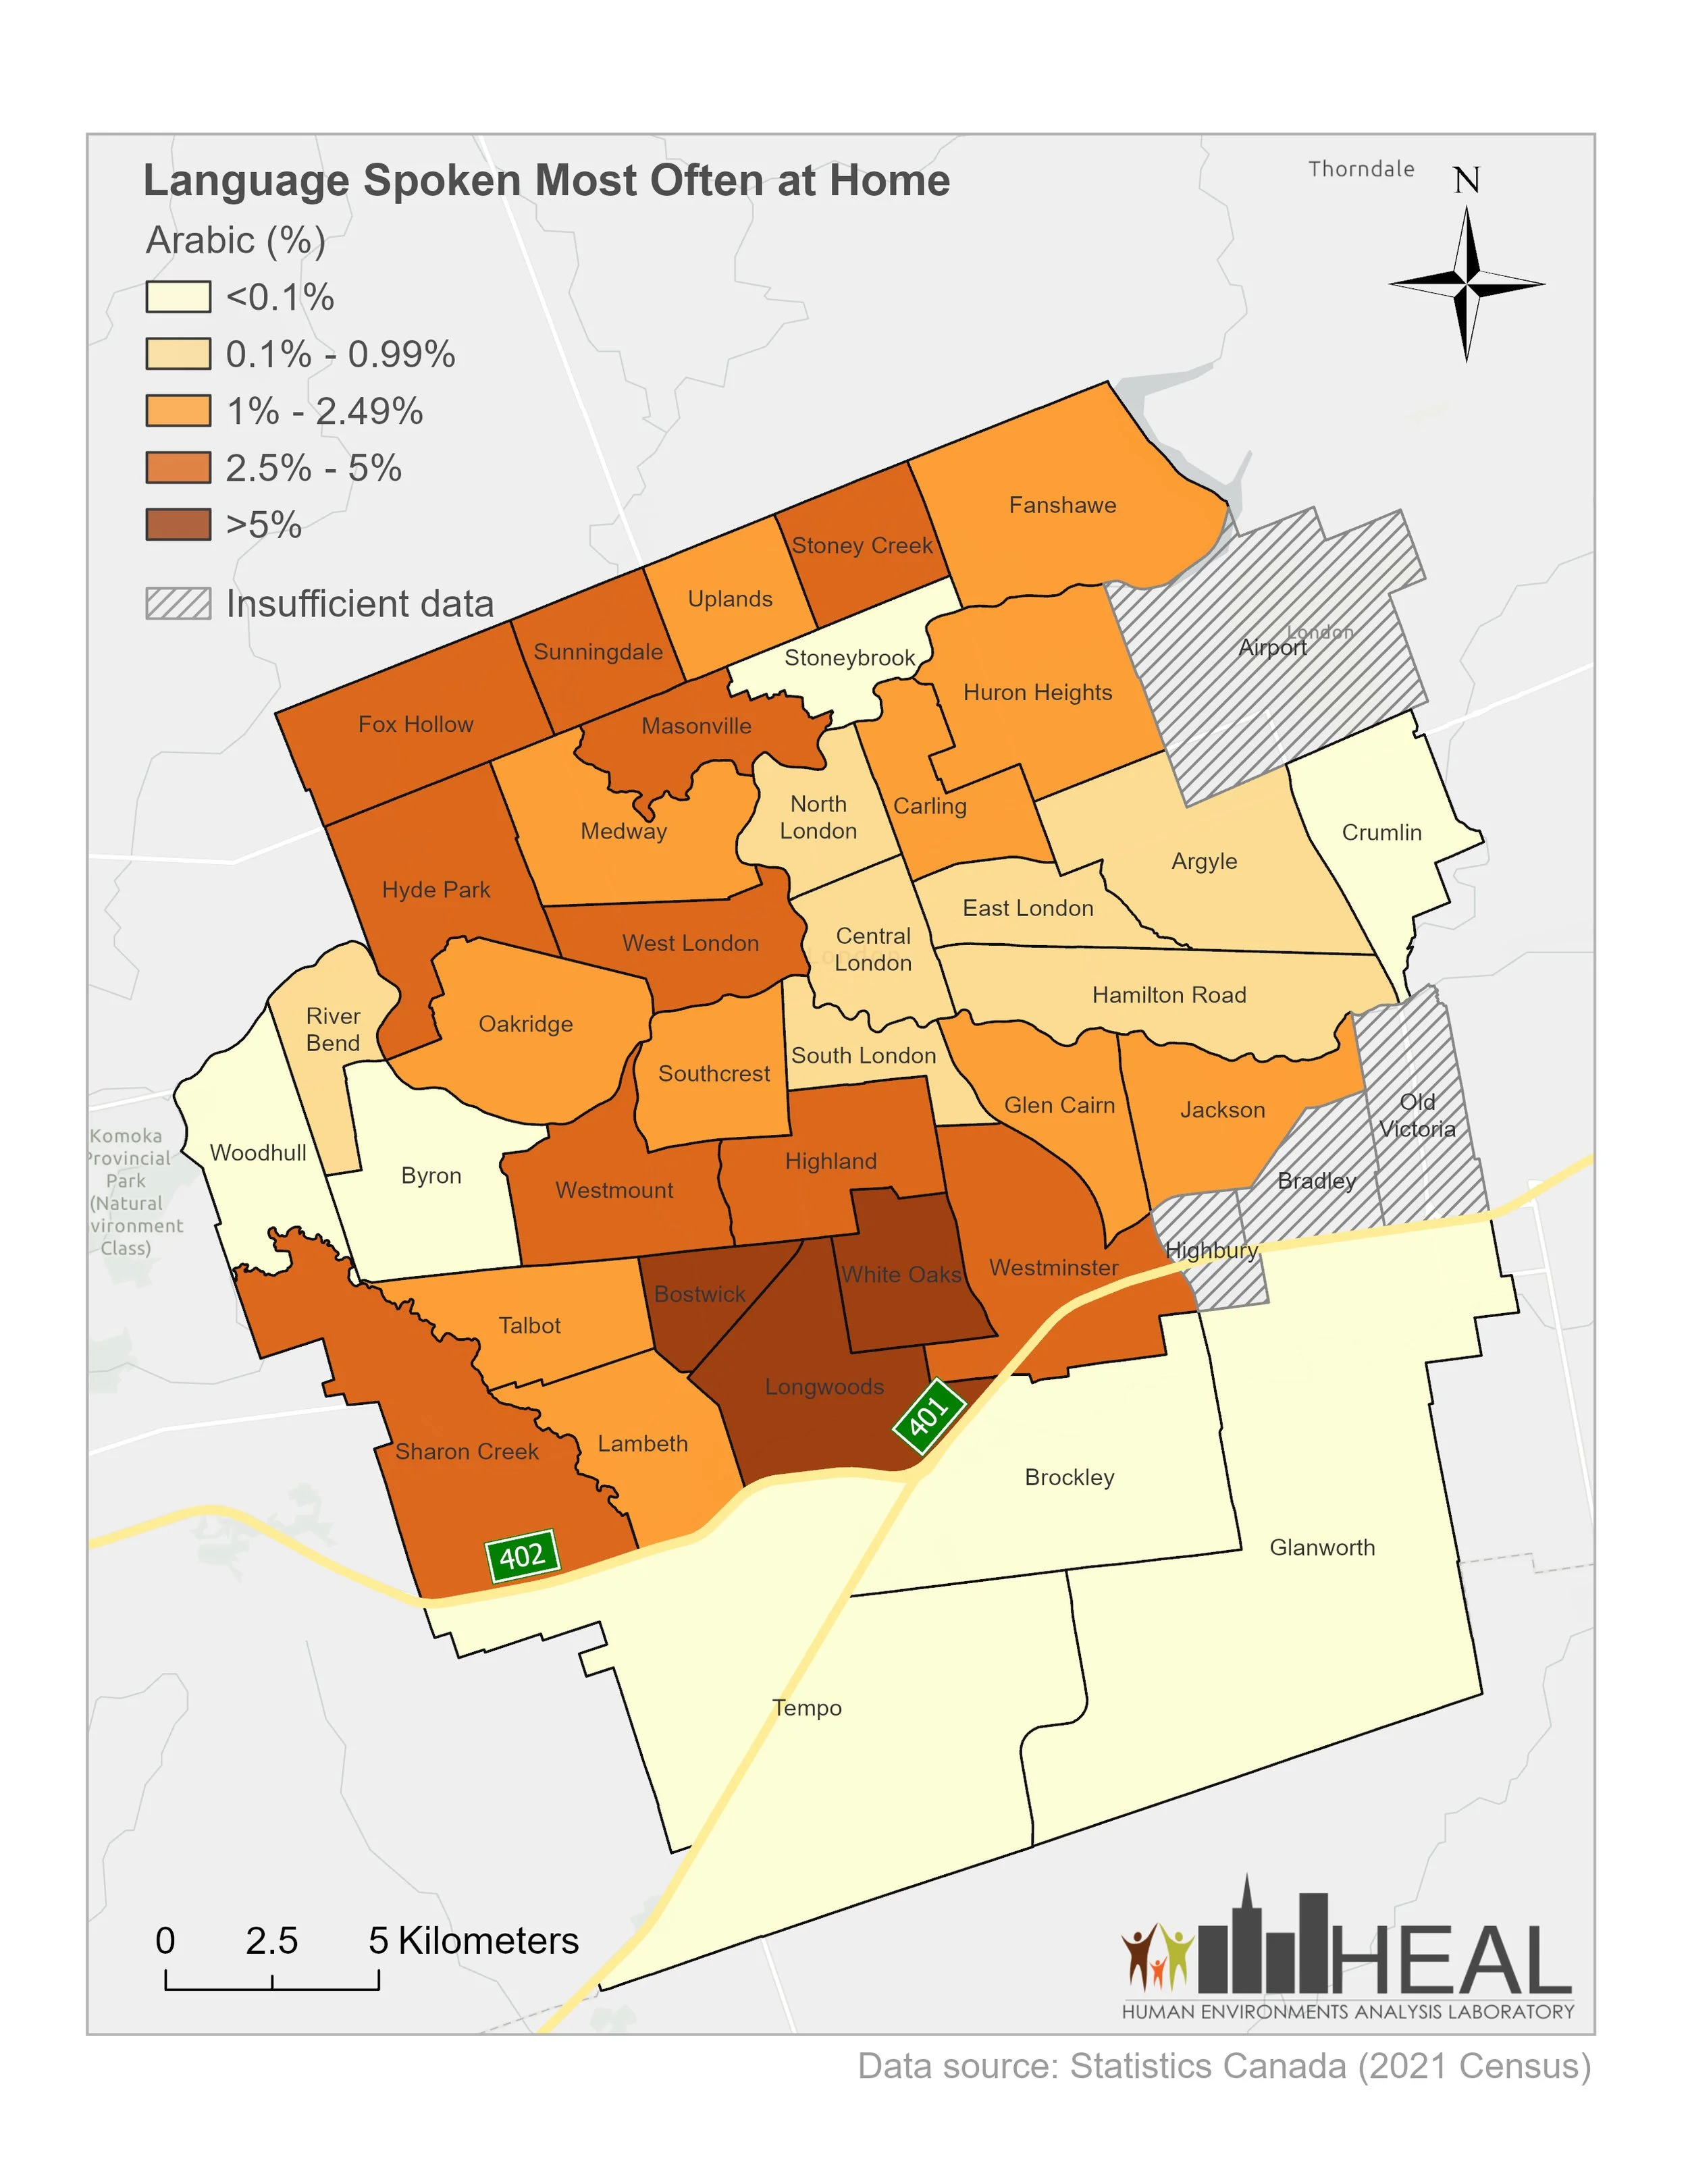
Arabic speakers are most concentrated in three South London districts, Bostwick, Longwoods, and White Oaks, where more than 5% of households speak Arabic at home. Moderate concentrations (2.5%–5%) appear in Sharon Creek, Westminster, Highland, Westmount, West London, Hyde Park, Fox Hollow, Masonville, Sunningdale, and Stoney Creek. This geographic spread across the city suggests an established community presence in multiple neighbourhoods.
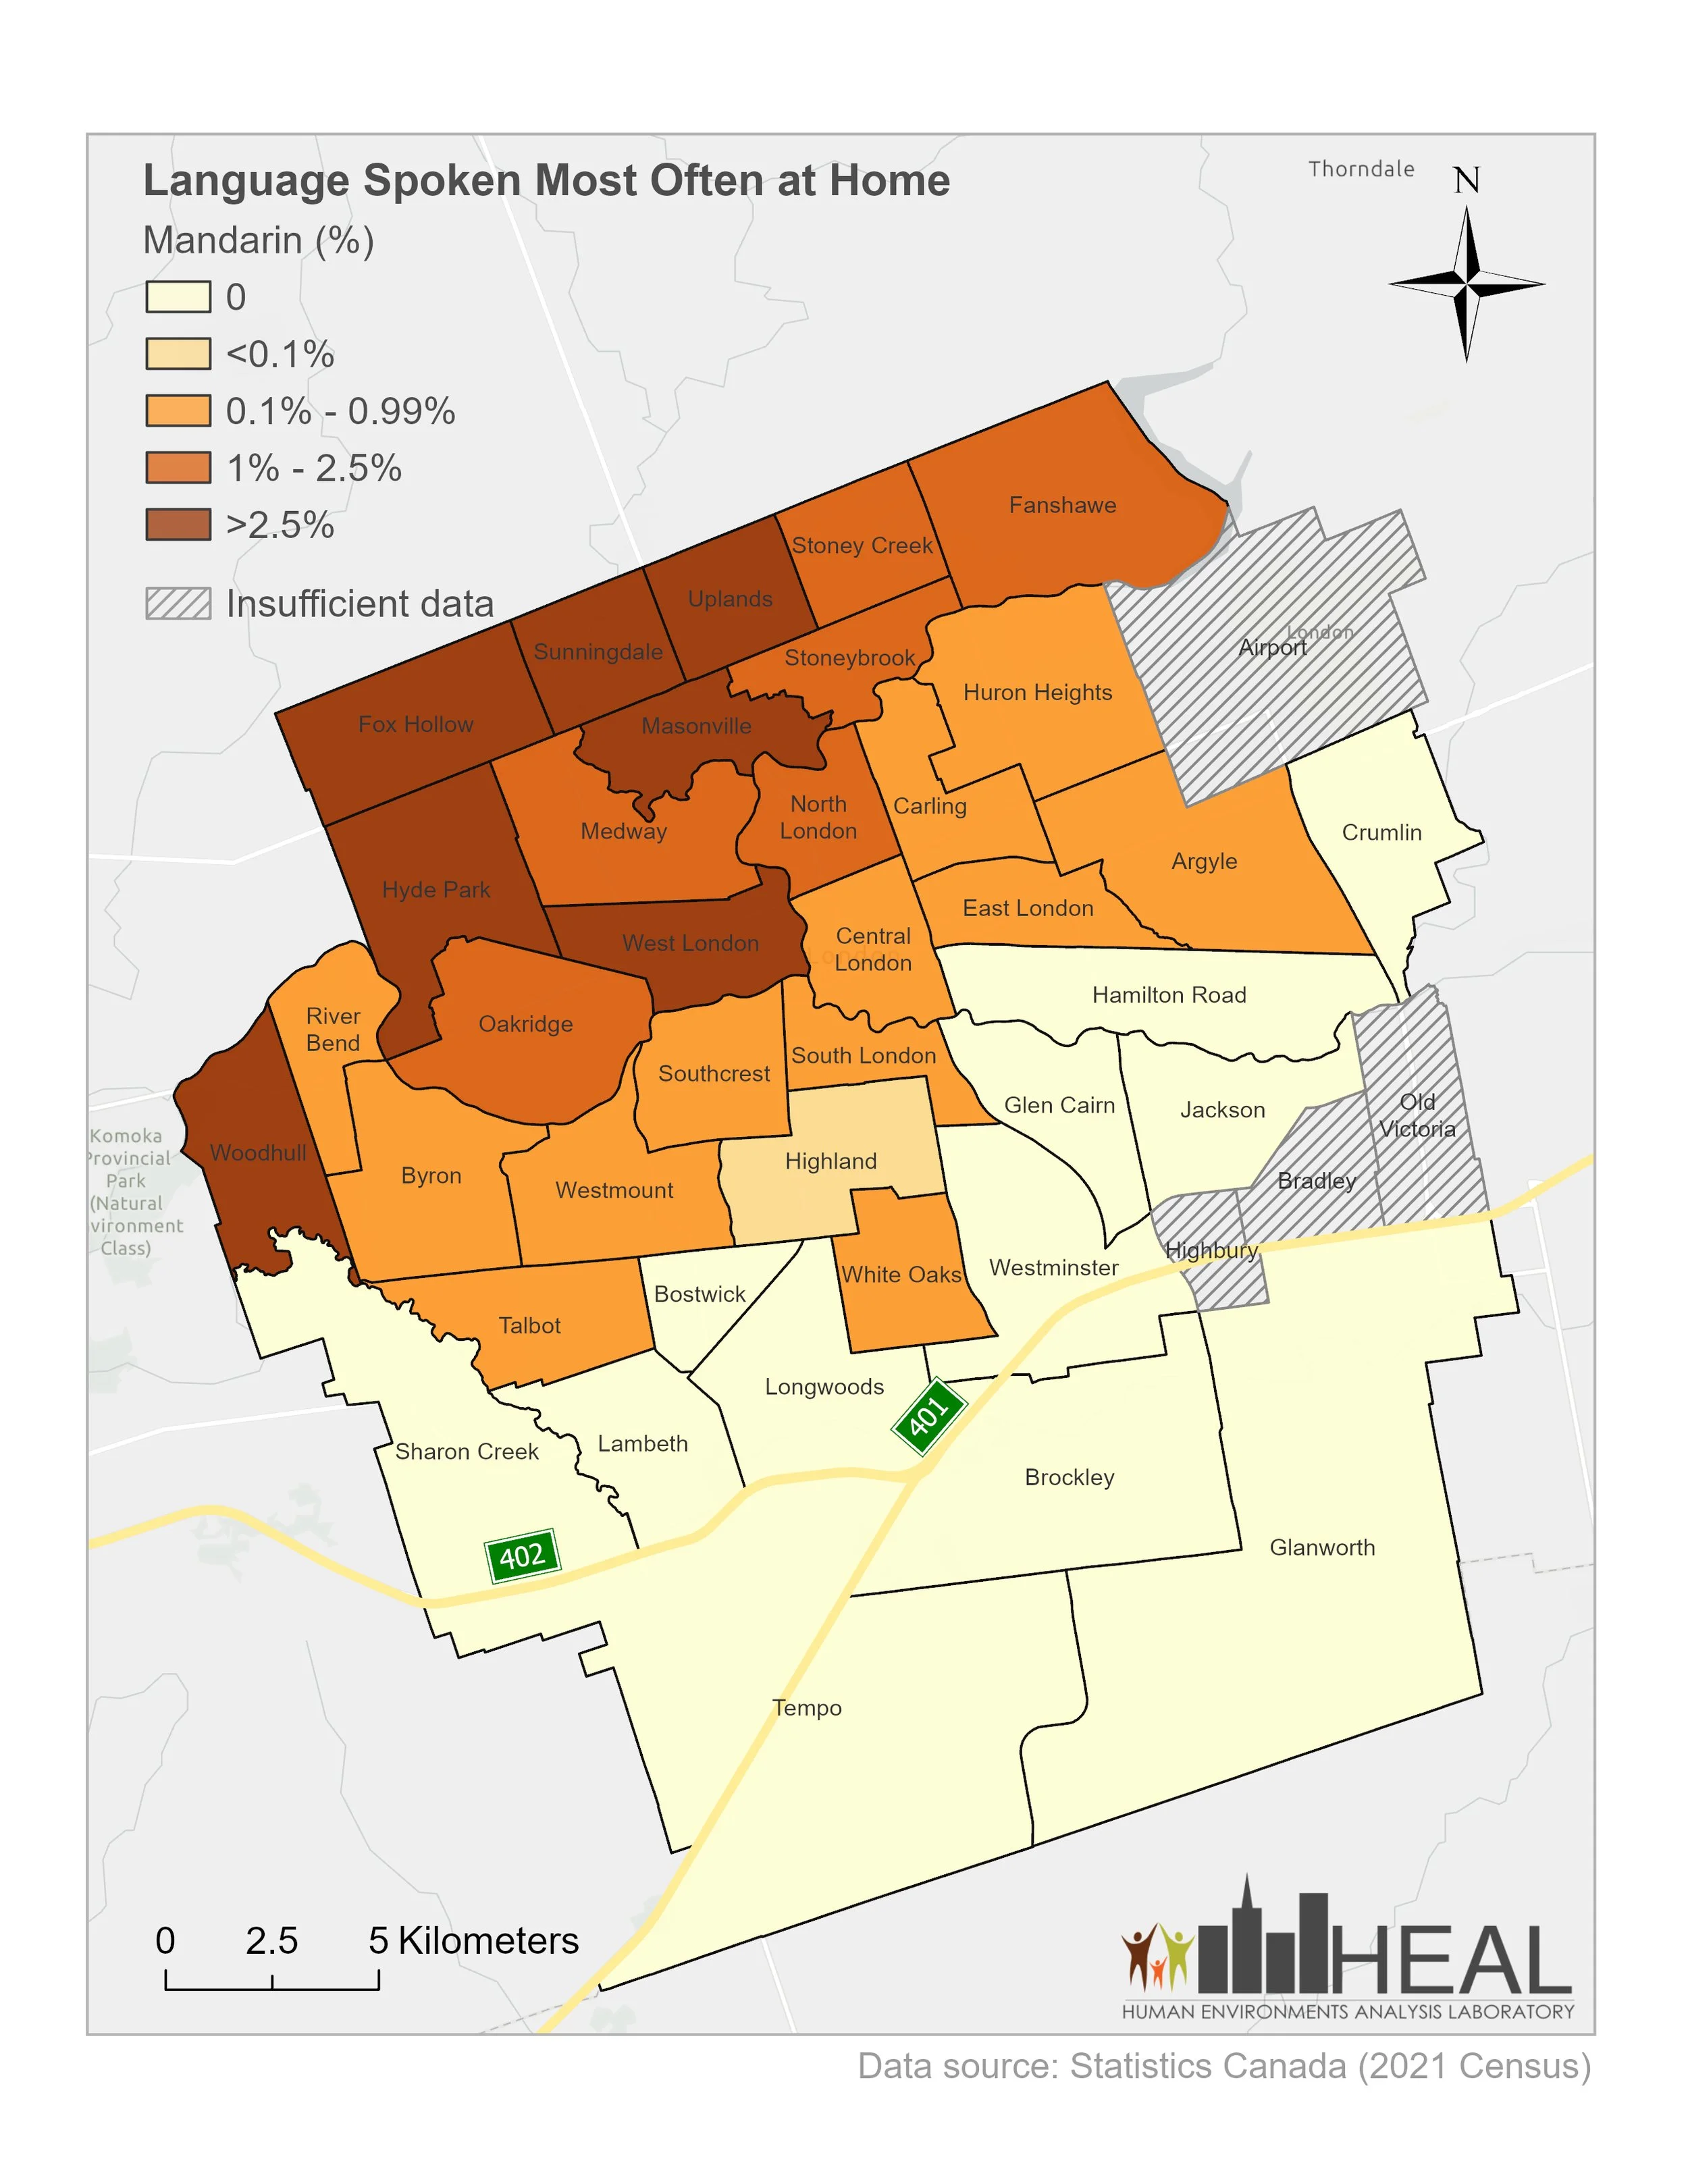
Mandarin speakers concentrate heavily (over 5%) in seven Northwest and West London districts: Woodhull, Hyde Park, West London, Masonville, Fox Hollow, Sunningdale, and Uplands. Additional moderate presence appears in Oakridge, Medway, North London, Stoneybrook, Stoney Creek, and Fanshawe. The clustering near Western University and Fanshawe College likely reflects student and academic connections.
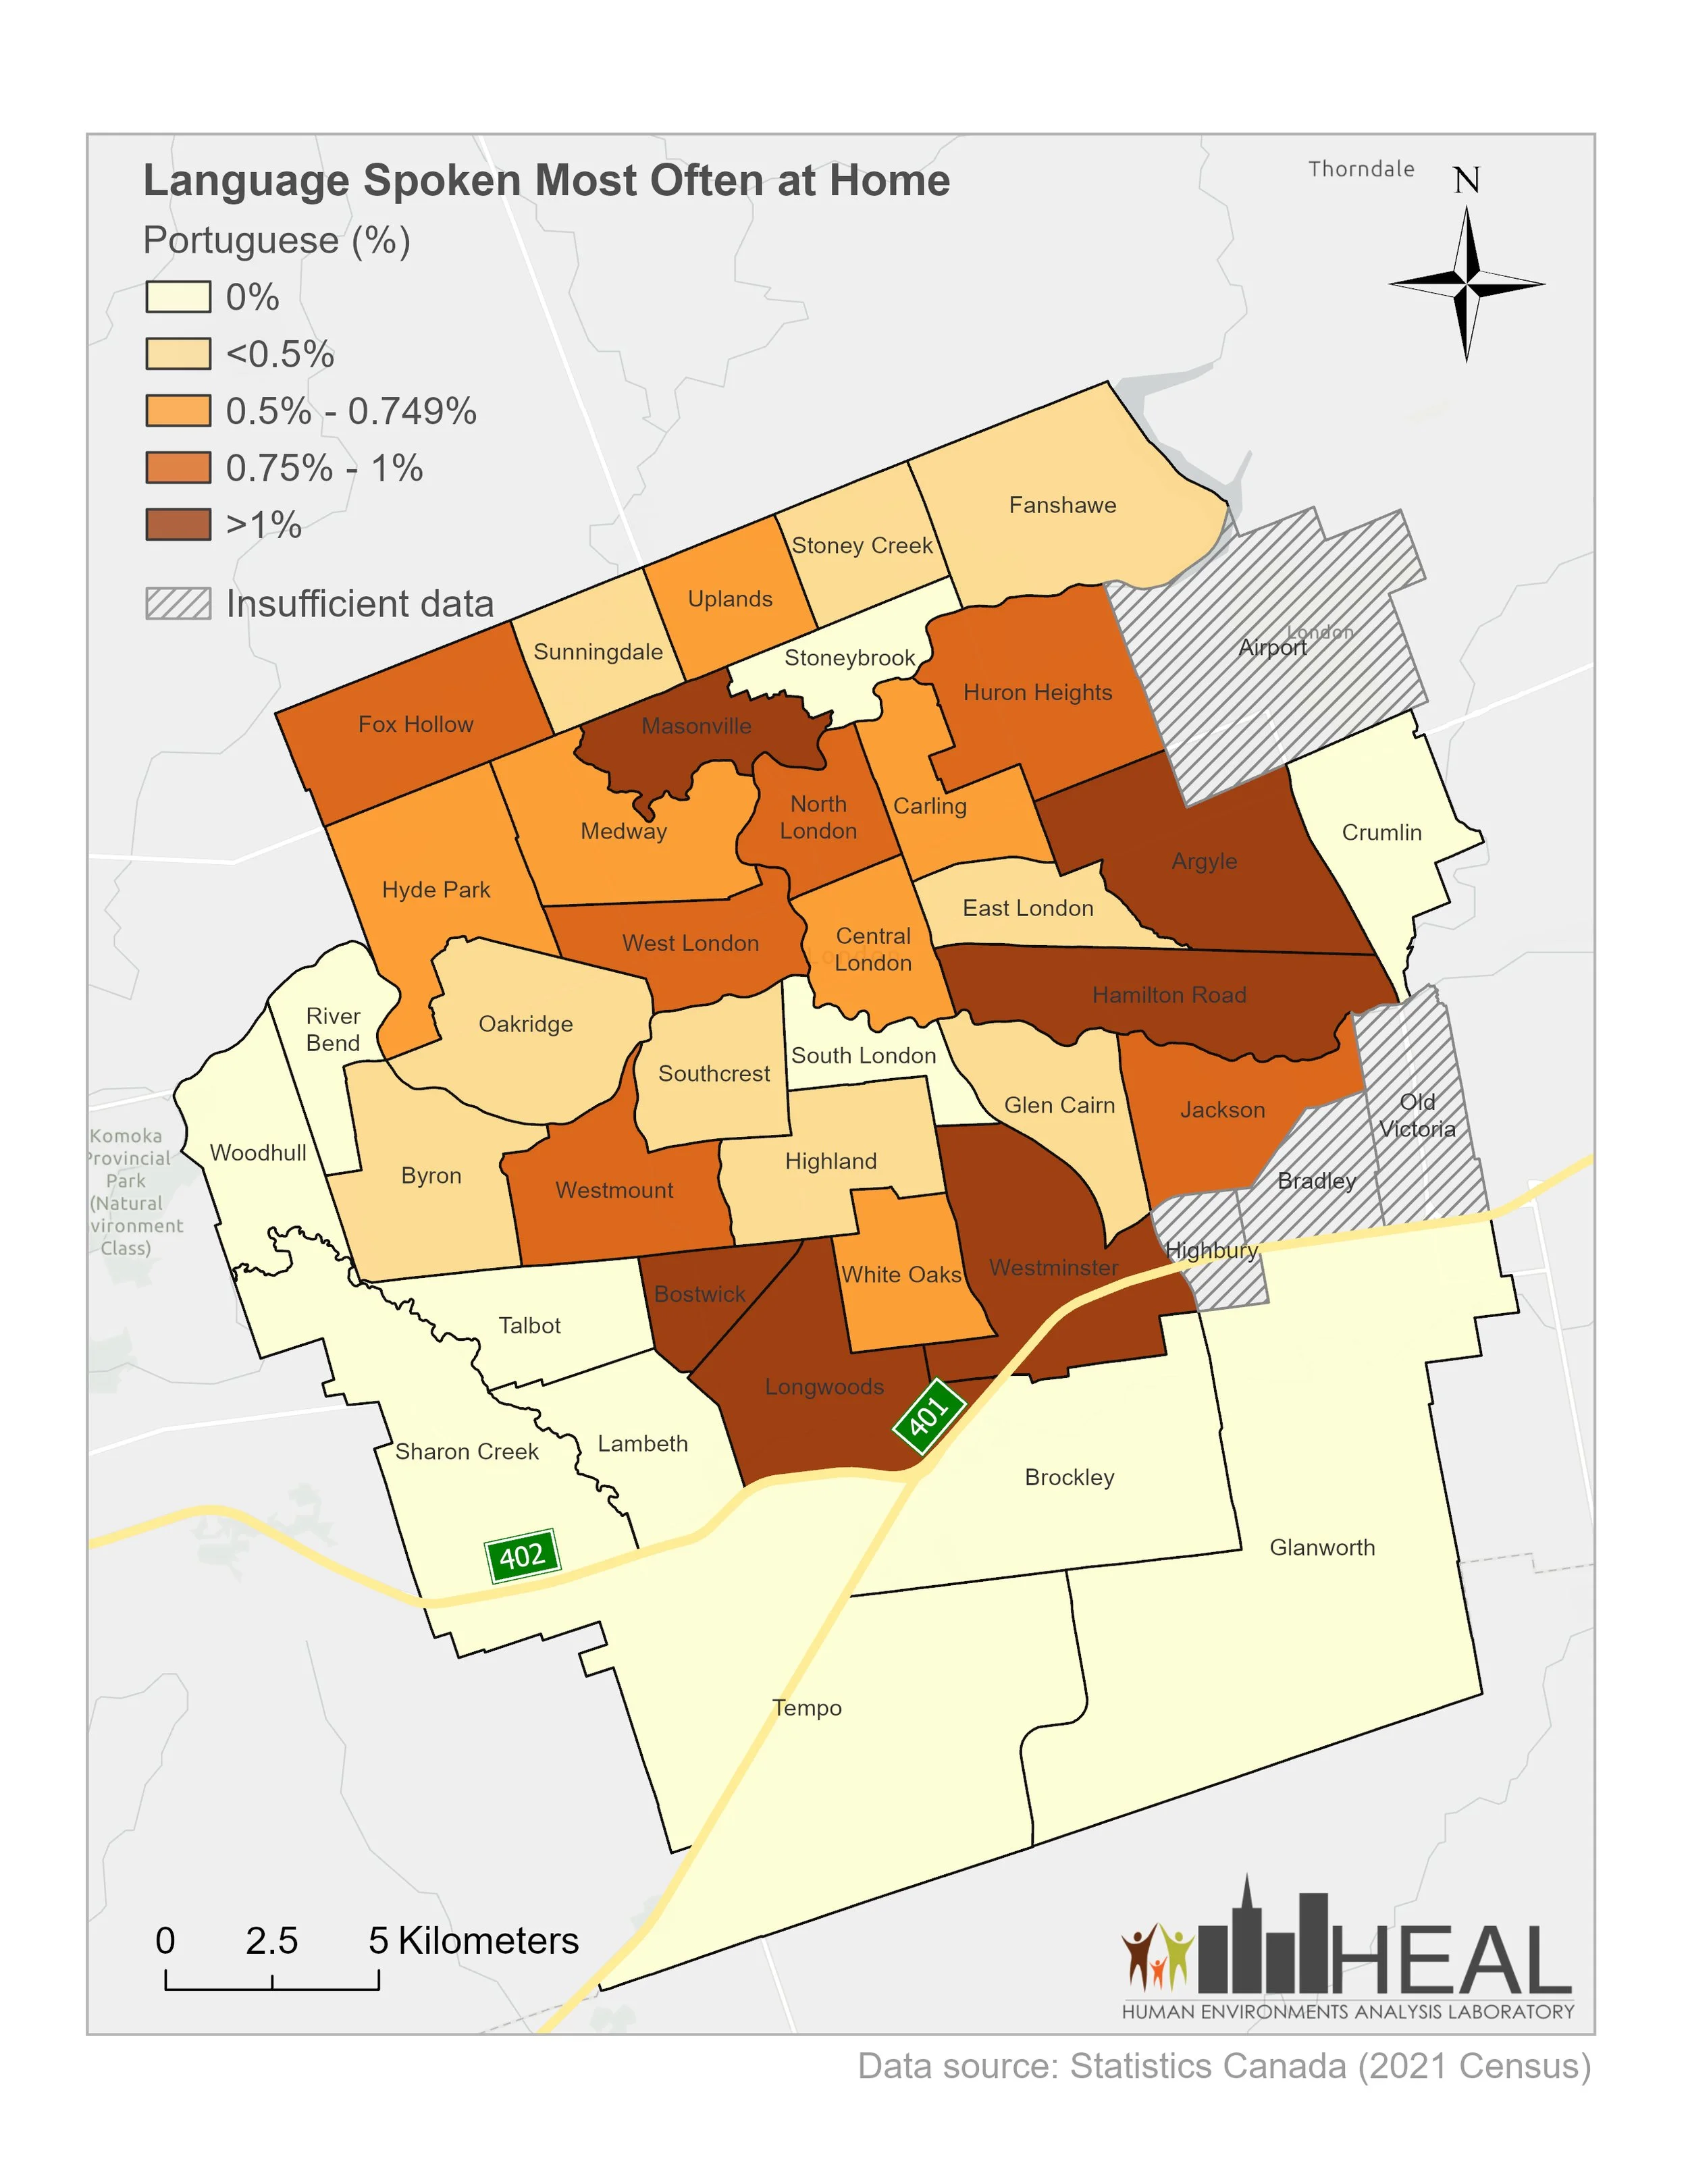
Portuguese speakers show a strong presence (over 5%) in six areas: Masonville, Argyle, Hamilton Road, Westminster, Longwoods, and Bostwick. Moderate concentrations appear in Jackson, Westmount, West London, North London, Huron Heights, and Fox Hollow. This distribution across South, East, and West London suggests a well-established community with ties to multiple neighbourhoods.
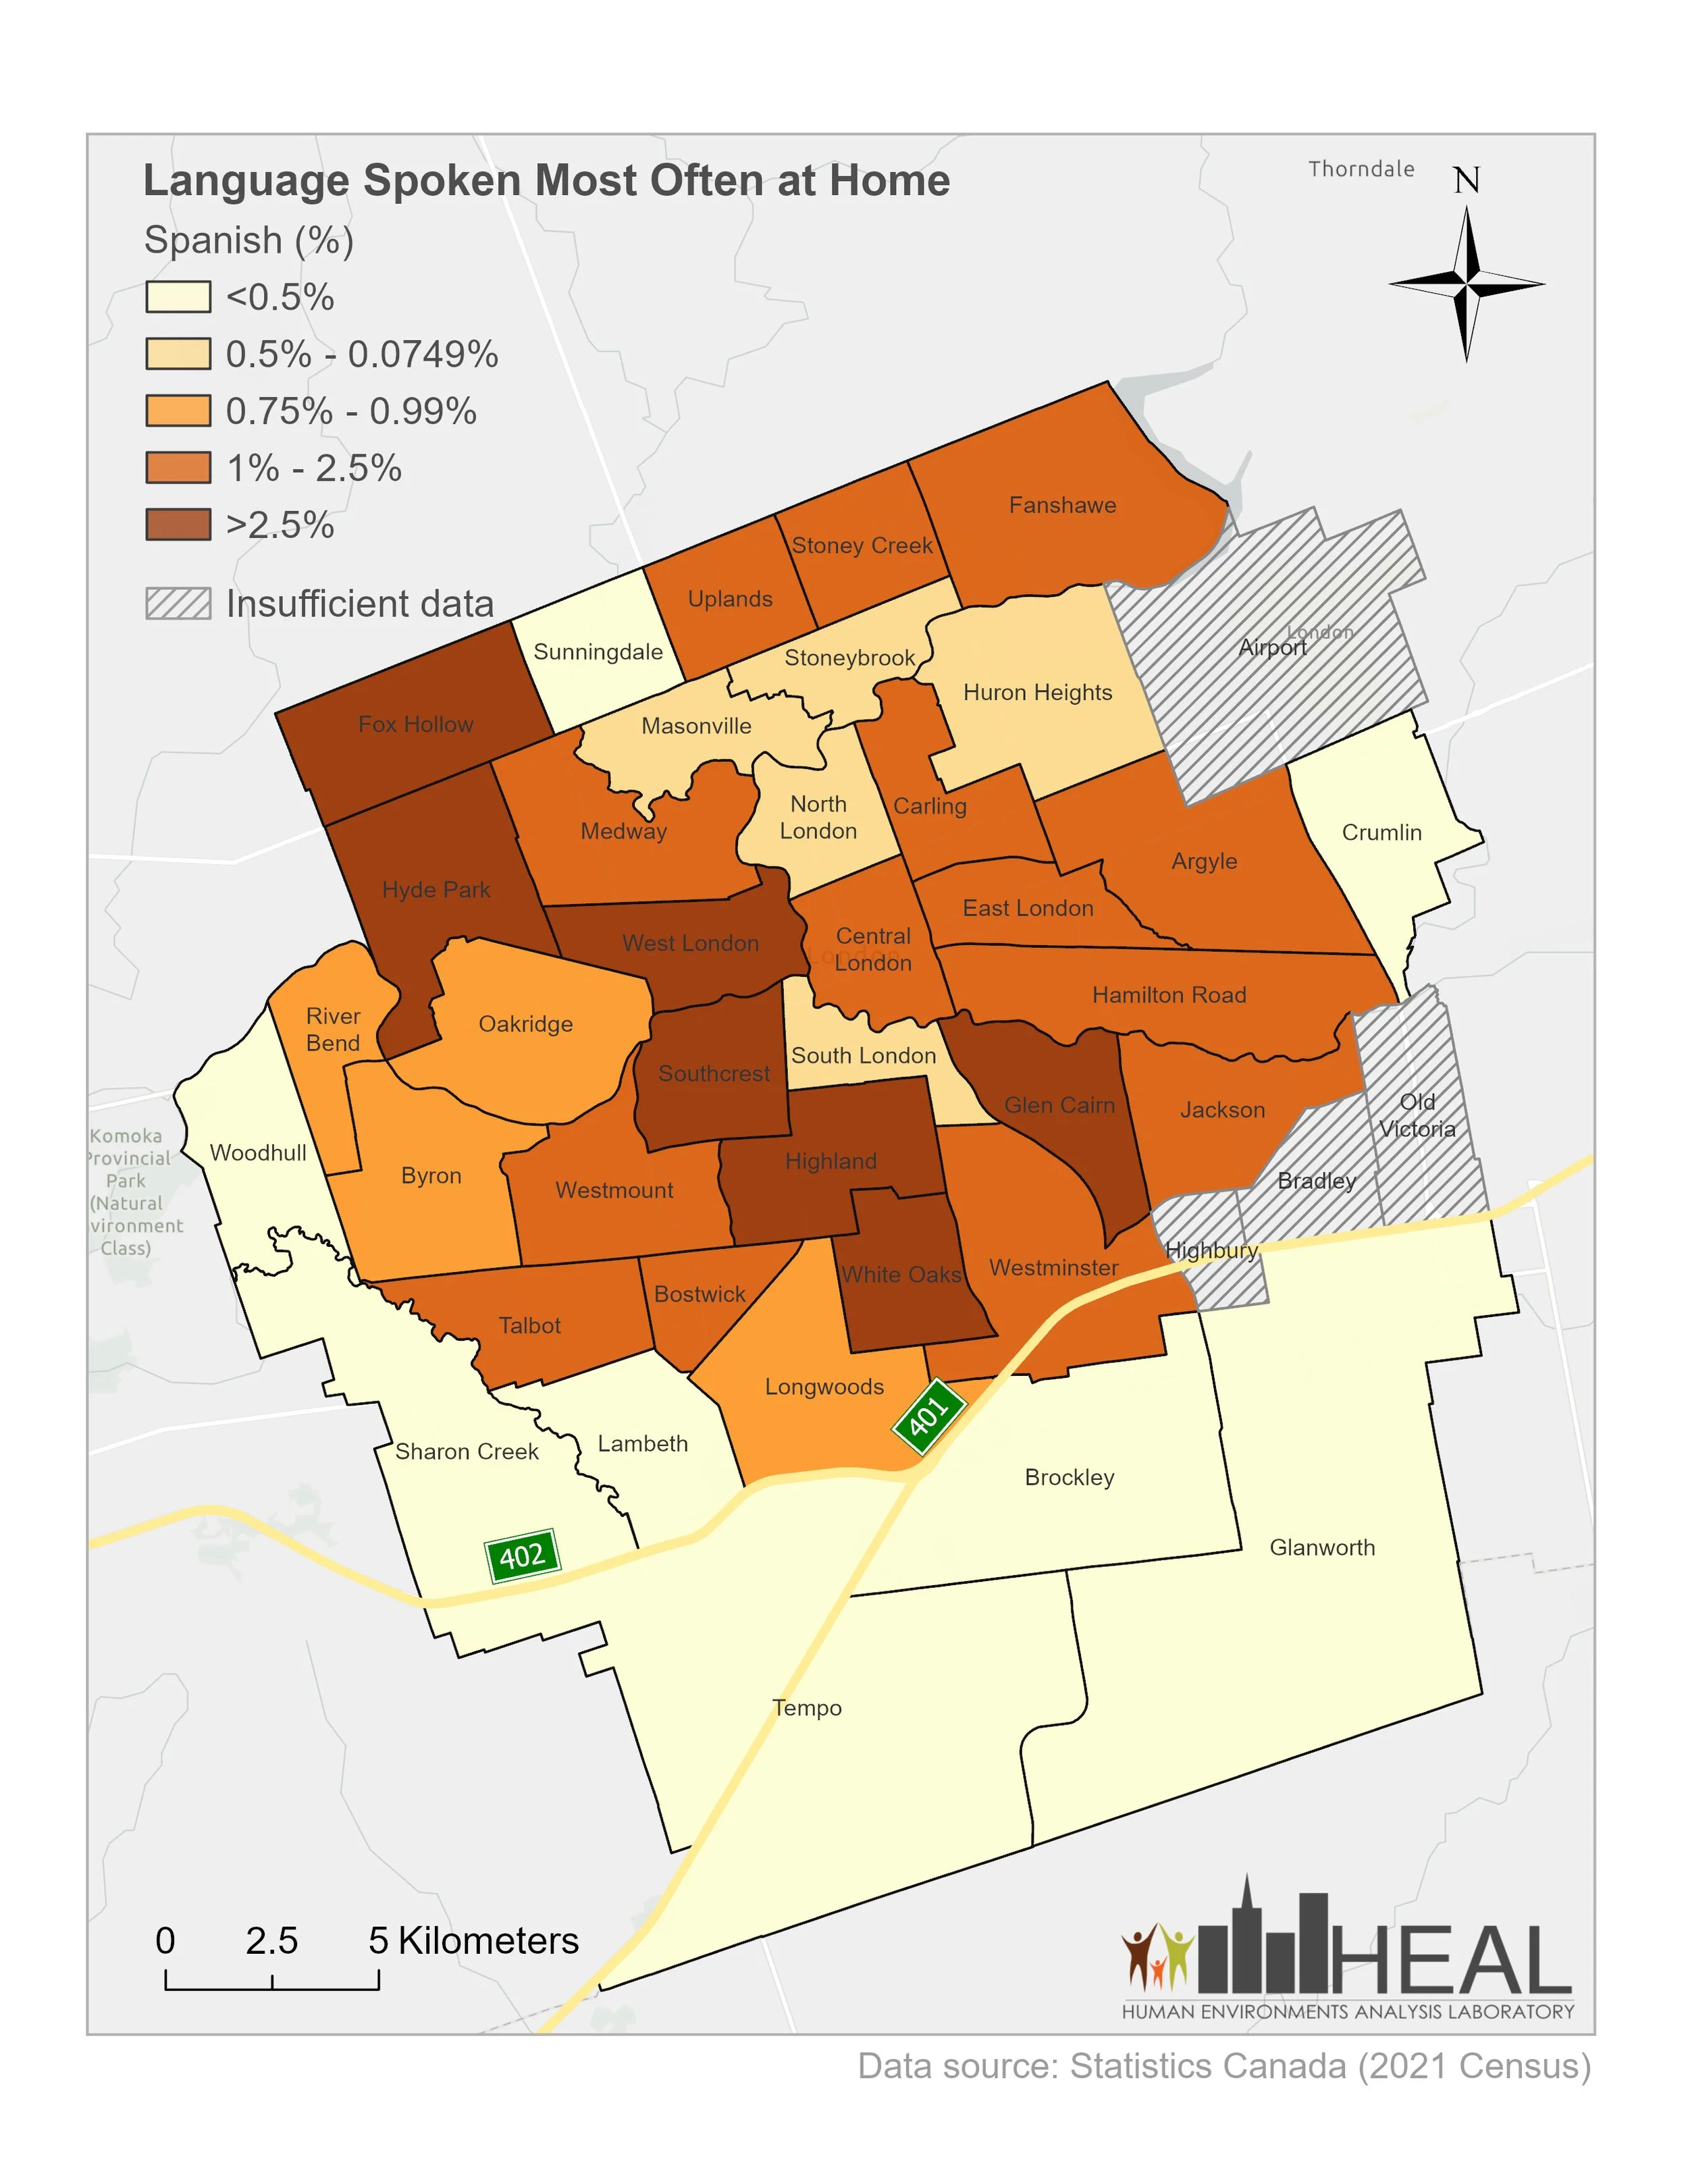
Spanish speakers appear most widely distributed, with strong concentrations (over 5%) in Fox Hollow, Hyde Park, West London, Southcrest, Highland, White Oaks, and Glen Cairn. Moderate presence extends across fourteen additional districts throughout Northwest, West, South, and Central London. The broad geographic spread may reflect the diversity of Spanish-speaking countries of origin—people from Colombia, Mexico, Venezuela, and Spain may settle differently based on their specific circumstances.
What This Means For Services
These patterns create both opportunities and challenges for service delivery.
When a language community clusters in specific neighbourhoods, agencies can plan more efficiently. A healthcare provider knowing that Bostwick has a high Arabic-speaking concentration can prioritize placing Arabic-speaking staff or interpreter services there. A school board seeing Mandarin concentration in Masonville can allocate Mandarin-speaking settlement workers to schools in that area. A community organization serving Portuguese speakers can locate programs in Hamilton Road or Westminster where Portuguese-speaking families live.
But concentration also creates risk. If services do not match where communities actually settle, gaps appear. Spanish speakers living in Fox Hollow need different service access than those in Glen Cairn or Highland. The wide distribution of Spanish speakers across the city means services must be more spread out to reach everyone effectively.
The data also reveals where multiple language communities overlap. Masonville appears on the concentration lists for Portuguese, Mandarin, and moderate Arabic. Fox Hollow shows high concentrations of Spanish and Mandarin speakers, with a moderate presence of Arabic. Services in these neighbourhoods need to serve multiple language groups well.
Using This Information
This data serves multiple purposes:
Healthcare planners can use the maps to decide where to place interpreter services, multilingual clinic staff, or culturally specific health programs. Knowing exactly where Arabic speakers live helps target diabetes prevention programs and mental health outreach that respect cultural context.
School boards can allocate English as a Second Language teachers, settlement workers in schools, and parent engagement resources based on where language communities actually live, not where assumptions suggest they might be.
Settlement agencies can decide where to open satellite offices, hold information sessions, or conduct outreach. The maps show which neighbourhoods need Spanish-language housing workshops, which areas would benefit from Mandarin-speaking employment counsellors, and where Portuguese-speaking family support programs make sense.
Community organizations planning cultural events, faith groups offering services in multiple languages, and neighbourhood associations trying to connect residents can see which areas have enough concentration to sustain language-specific programming.
Municipal planners making decisions about where to place multilingual signage, translated information materials, or community facilities can use the data to ensure resources reach the people who need them.
The maps represent the 2021 Census, so the patterns have continued to evolve over the past few years. Immigration policy changes, international student caps, and economic factors will shape future settlement patterns. But the 2021 data provides a baseline, a clear picture of where communities formed and where services should be designed to reach them.
Neighbourhoods Are Communities
Language clustering is not a failure of integration. It is how integration begins. Families settle near others who can help them navigate a new system, find work, access services, and build lives. The informal support networks created through language community clustering often provide what formal systems cannot: immediate help, cultural understanding, and genuine belonging.
The question is not whether communities should cluster. They will. The question is whether the services meant to support settlement and integration are located where communities have actually formed.
These maps answer that question. They show exactly where Spanish-, Portuguese-, Mandarin-, and Arabic-speaking households live across London. Now the work is to ensure programs, services, and support reach these neighbourhoods effectively.
The London & Middlesex Local Immigration Partnership's Fact Sharing Work Group created these maps using 2021 Census data and analysis from Western University's Human Environments Analysis Laboratory. The full Matter of Facts series provides data-informed insights about immigration and settlement in the London-Middlesex region.