A degree, and a job that does not need one
Matter of Facts, Part 58. Prepared by the London & Middlesex Local Immigration Partnership Fact Sharing Work Group.
London has two new job maps. The first counts everyone who has a job or is looking for one. That is the participation rate. The second counts the people who are looking but cannot find work. That is the unemployment rate.
White Oaks sits at the bad end of both. Its participation rate is under 57.5%, one of the lowest in the city. Its unemployment rate is above 15%, the highest. White Oaks is the only district in London at the extreme end of both maps. An earlier Matter of Facts placed it among the districts where recent immigrants settle most heavily.
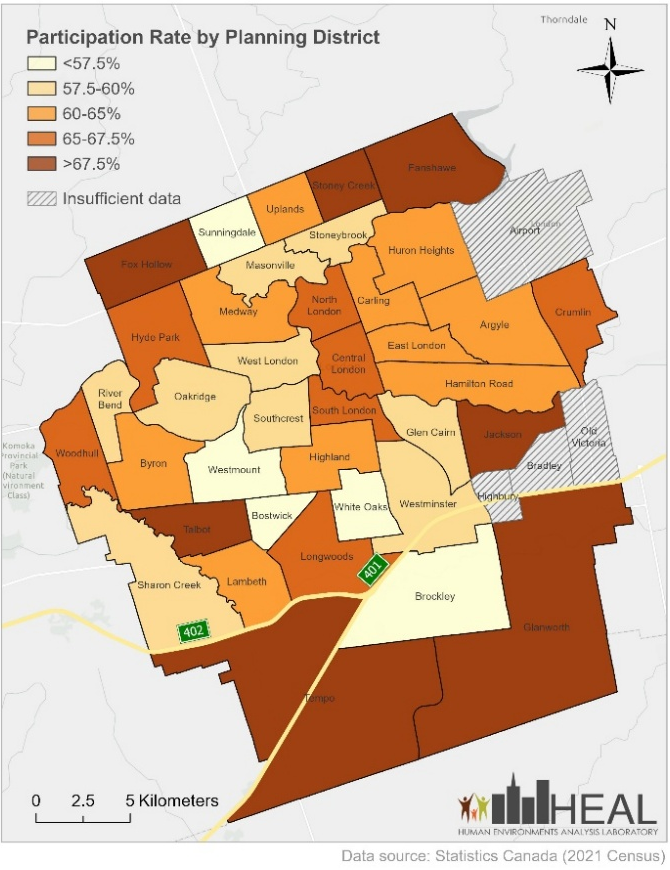
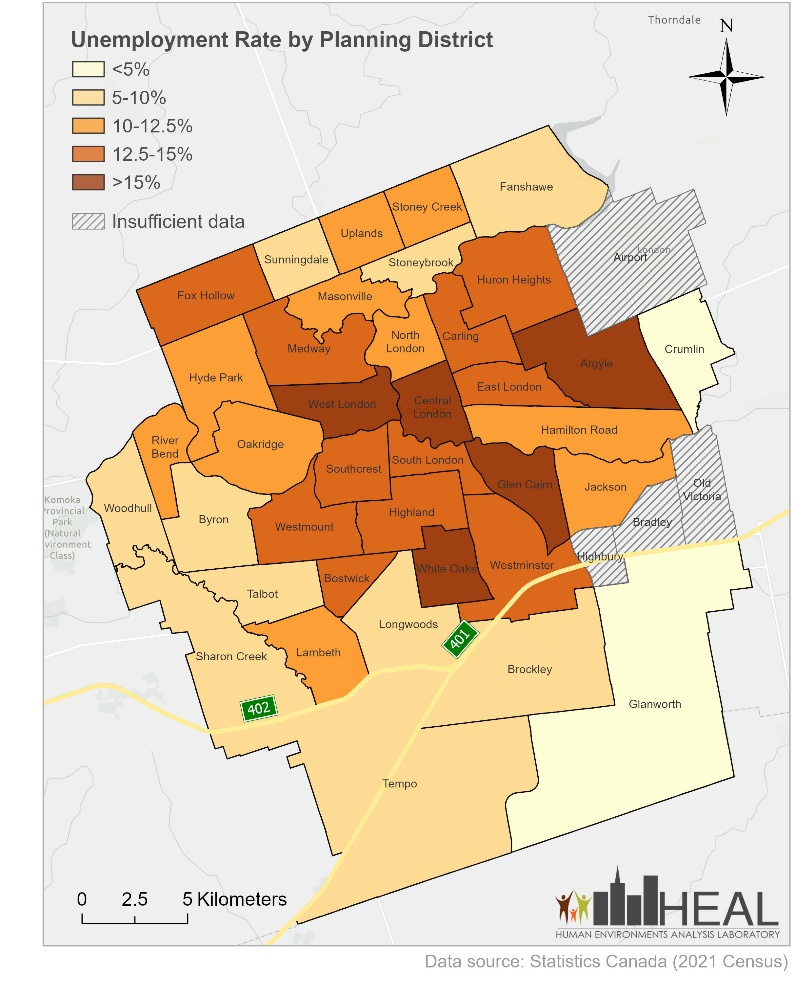
"Participation Rate by Planning District." and "Unemployment Rate by Planning District." Source: Statistics Canada, Community Data Program, Ontario 3, 2021 Target Group Profile. Map prepared by the Human Environments Analysis Laboratory, Western University.
That looks like the beginning of a story about newcomers and unemployment. Local data says it is not.
Last year's survey of newcomers to London-Middlesex asked 387 permanent residents about their work. Most of them had jobs. 53.5% were working full-time and 20.9% were working part-time. 8.8% were unemployed and looking for work.
Set those numbers beside the maps and newcomers come out fine. Both maps ask a version of the same question. Are you working, or are you looking for work? Most newcomers in London pass that test.
Then look at what the work is.
More than 60% of the people surveyed hold a university undergraduate, graduate or professional degree. Nearly 30% more finished college or vocational training. More than 85% earned that qualification outside Canada.
The largest single group of them, 26.8%, works in jobs that require no formal education at all. Only 23.6% hold jobs that usually call for a university degree. More of these newcomers work in jobs needing no schooling than in jobs matching the degrees most of them have.
Neither map can see this. Think of someone who arrived with an engineering degree and now works a job that needs no formal training. The unemployment map counts that person as employed. The participation map counts them too. Both maps score them as a success.
The gap falls unevenly. Among the women surveyed, 37.4% work in jobs requiring no formal education. That figure reaches 47.3% for those born in Sub-Saharan Africa, and 53.8% for those who came to Canada as refugees.
The survey also asked why suitable work was hard to find. The most common answer, from 43.5%, was a lack of Canadian work experience. Next came a shortage of jobs matching their qualifications. After that: skills that differ from the ones Canadian employers want, limited English, and a lack of connections.
That first barrier changed this year. Ontario employers with 25 or more staff can no longer ask for Canadian experience in a public job posting or on an application form. The rule took effect on 1 January 2026.
Two limits are worth naming. The maps come from the 2021 Census. It asked about the week of 2 to 8 May 2021. Ontario was under a stay-at-home order that week, and many people were laid off or working fewer hours. Neither map measures immigration, so the survey rather than the maps is what tells us about newcomers here.
What to do with this. If you hire, look past whether a candidate is working. Ask whether the work uses what they trained for. Check your job postings for a Canadian experience line, since employers with 25 or more staff are no longer allowed to ask. If you plan services, the maps point to the districts with the least available work. The survey points to a second problem underneath it: people already working, well below what they were trained to do. Newcomers can reach local employment and settlement support through City of London newcomer services.