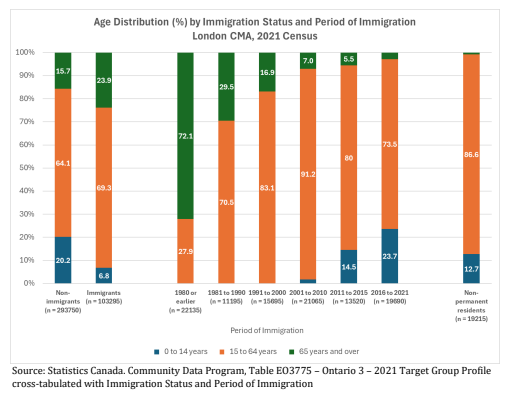
London's immigrants are more likely to be working age than people born here
Picture the typical immigrant household in London. Who do you see?
Chances are it's a family, parents, children, maybe a grandparent nearby. That image drives a lot of how immigration gets talked about in Canada, and, quietly, a lot of how services get designed and funded. The 2021 Census data for the London Census Metropolitan Area tells a more specific story. It doesn't match the postcard.
Working age, partnered, present
The most striking finding from Matter of Facts 51, produced by the LMLIP Fact Sharing Work Group, is one that doesn't get much airtime: immigrants in London are more likely to be of working age (15–64) than non-immigrants. Sixty-nine percent of immigrants fall in that range, compared to 64% of non-immigrants. The share of children under 14 is much smaller among immigrants: 7%, against 20% among non-immigrants.
This reflects decades of federal policy that explicitly selects for economic immigrants. Nearly 65% of new permanent residents will be economic immigrants by 2027; the working-age profile of London's immigrant population is, in part, exactly what the selection system is designed to produce.
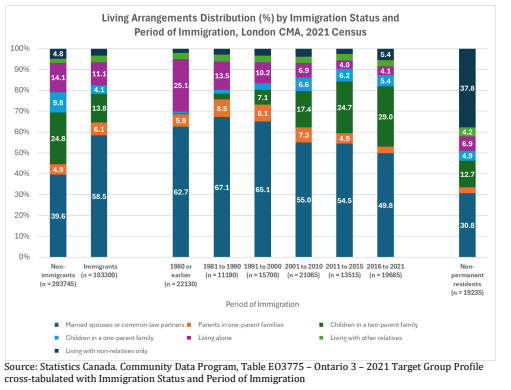
The living arrangements sharpen the picture further. Immigrants are substantially more likely than non-immigrants to live with a married spouse or common-law partner: 59% versus 40%. So the dominant immigrant household in London is a couple, probably both working age, probably without children at home. Not quite the image that anchors most public discussion.
Two different populations
One thing the data makes clear is that "immigrants" and "non-permanent residents" are not the same group, though they often get folded together.
Non-permanent residents (international students, temporary workers, and others without permanent status) are even more concentrated in working age, with 87% in the 15–64 range. But their household arrangements look quite different from immigrants. Thirty-eight percent live with non-relatives; people not connected by blood, marriage, or adoption. Think roommates dividing rent, or students sharing a house near a campus (which, depending on the neighbourhood, might be exactly what you'd see on a given street in London). This population has distinct pressures around housing, social isolation, and access to supports.
What arrival cohort data shows
The Census lets us look at immigrants by when they arrived, and the picture shifts depending on the decade.
Among people who arrived between 2016 and 2021, 29% of immigrant household members are children under 14, the highest share of any arrival period. This is London's most recent wave, and the most family-heavy. At the other end, immigrants who arrived in 1980 or earlier are mostly elderly now, with 72% aged 65 and over. Twenty-five percent of that long-settled group lives alone.
That last number is easy to scroll past. Long-settled immigrants living alone don't fit neatly into the "newcomer needing settlement services" frame, and they may not fit mainstream seniors services either. They're in the data, though, and the data is from 2021, which means that population has only gotten older since.
Why this matters now
This data is from the 2021 Census, the most detailed local picture available for the London CMA. A lot has changed since then.
Canada's 2025–2027 Immigration Levels Plan reduced both permanent and temporary resident targets. The effects are already visible nationally: Canada's working-age population grew by just 0.4% between 2024 and 2025, down from 3.2% the year before. Natural population increase, births minus deaths, contributed less than 20,000 net nationally in 2024. Immigration is essentially the whole story of Canada's population growth, and the working-age tilt of that immigration is what the 2021 London data documents.
The 2021 numbers are a baseline. They show what this community looked like when immigration was contributing substantially to working-age population growth. That contribution is now shrinking. The local picture will follow.
A clearer starting point
The gap between the imagined immigrant and the actual one has real consequences. Programming built around families with young children serves a real population, just not the majority of it. A working-age couple with no children at home, a non-permanent resident sharing a flat with three others, a long-settled immigrant in their seventies living alone — all of these people are also part of London's immigrant community. They have different access points, different needs, and different relationships to the services that exist for them.
The 2021 data doesn't tell us what to build. But it does tell us who is actually here — and that's a better place to start than a postcard.
Matter of Facts 51 was prepared by the LMLIP Fact Sharing Work Group, drawing on data from Statistics Canada's 2021 Census, Community Data Program, Table EO3775.